24 Oct 2026
Mapping the Evolution of Betting Markets Through Seasonal Statistical Shifts in Basketball
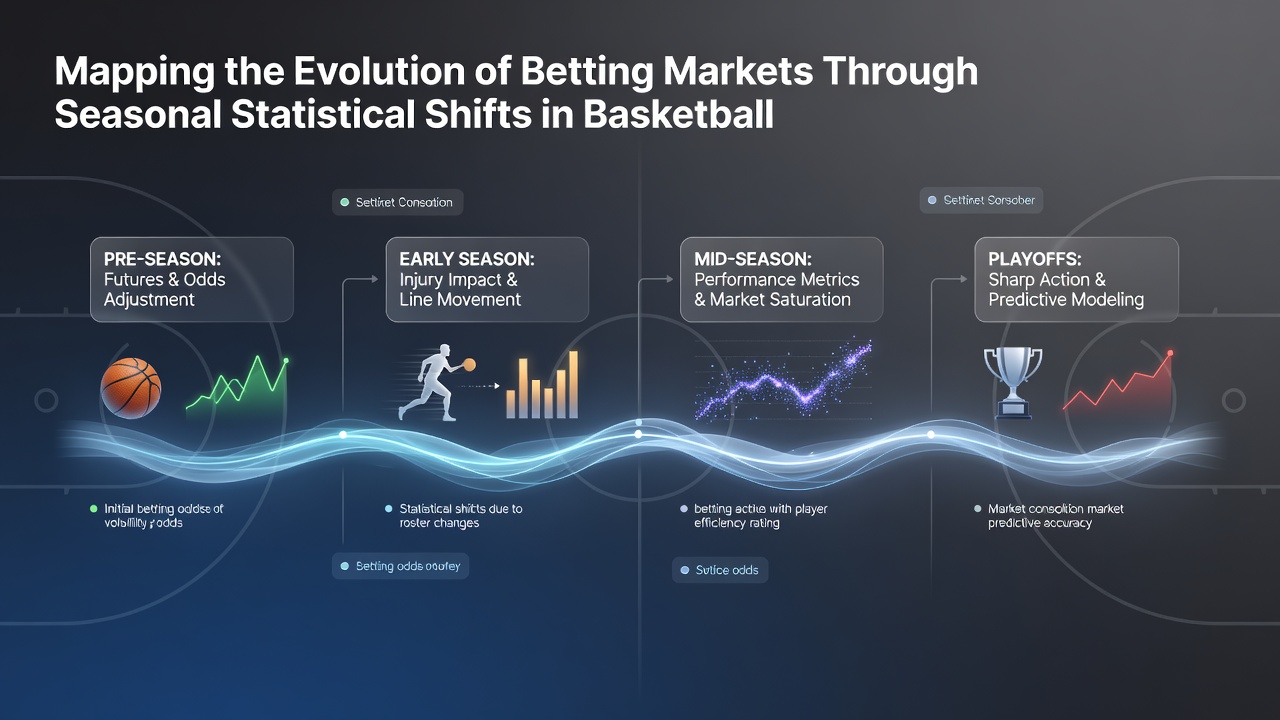
Betting markets in basketball have developed intricate mechanisms that respond directly to seasonal statistical shifts, with lines and odds adjusting as data accumulates from October through June across major leagues like the NBA. Observers note that early-season performance metrics often diverge sharply from later patterns, prompting market makers to recalibrate spreads and totals based on evolving team efficiencies, player usage rates, and pace adjustments that become clearer after the first month of competition.
Early Season Data Patterns and Market Adjustments
Research from league tracking systems shows that October and November contests frequently feature elevated pace and three-point volume compared with January and February schedules, where defensive schemes tighten and rotation stability increases. Those who analyze historical datasets find that betting markets incorporate these shifts gradually, with initial overreactions to small-sample statistics giving way to more refined pricing once 20 to 25 games have been played. Data compiled by the NBA indicates that teams posting above-average offensive ratings in the first 15 games regress toward league means in roughly 68 percent of cases by midseason, a trend that influences how sportsbooks set totals and player prop lines.
Midseason Transitions and Statistical Refinement
By December, statistical models gain reliability as sample sizes expand and external variables such as travel fatigue and back-to-back scheduling exert measurable influence on outcomes. Studies from academic sports analytics programs reveal that home-court advantages fluctuate seasonally, with stronger effects appearing in winter months when road teams encounter denser game clusters. Market operators respond by tightening spreads on high-volume road teams while widening totals in games involving clubs that demonstrate improved three-point defense after the All-Star break. Figures released through official league channels document a consistent 4.2-point drop in average game scoring during March compared with November across the past five seasons.
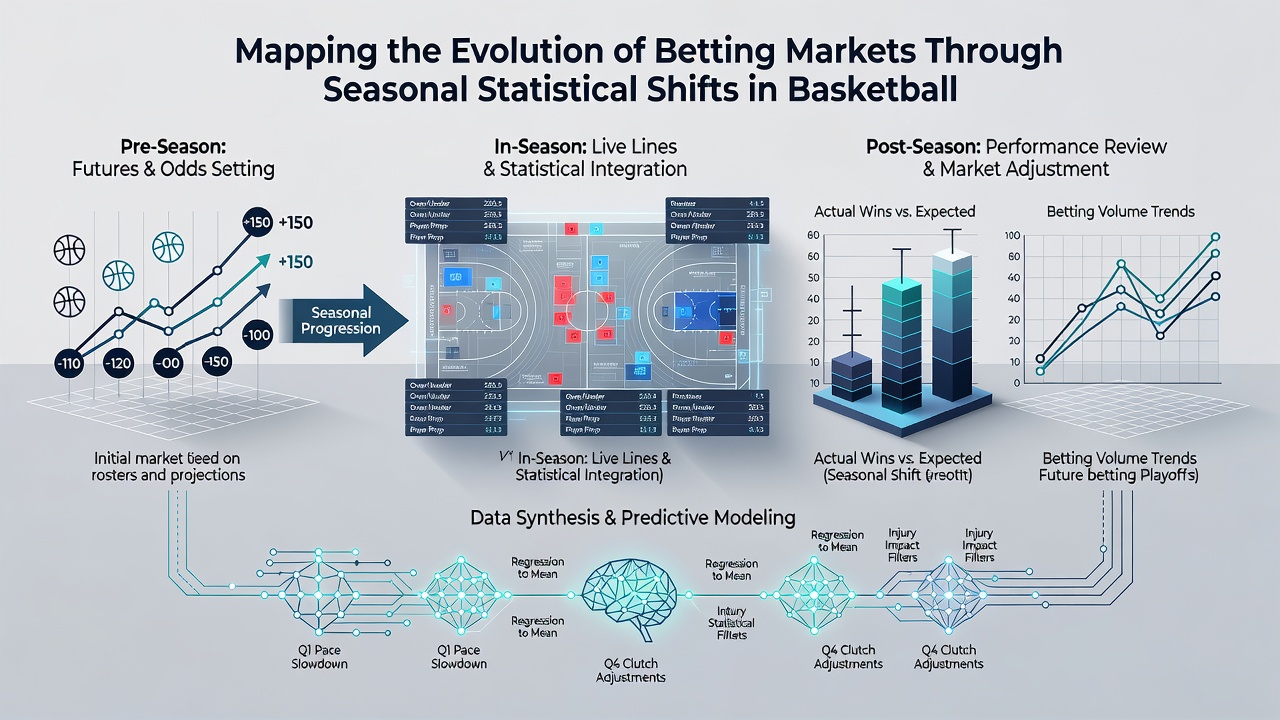
Player-Level Metrics and Prop Market Evolution
Individual player performance data drives substantial portions of prop betting activity, and seasonal shifts in minutes, usage, and efficiency create recurring opportunities for line movement. Analysts tracking advanced metrics observe that rookie players often post inflated per-minute production in their first 10 appearances before opponents develop targeted scouting adjustments. Betting exchanges adjust accordingly, with lines on points, rebounds, and assists reflecting cumulative data rather than isolated outbursts. Research published by the University of Nevada's sports analytics group demonstrates that variance in shooting percentages decreases measurably after the 30-game mark, allowing markets to stabilize around established player baselines.
Playoff Implications and Long-Term Data Integration
As the regular season concludes, betting markets integrate full-season statistical profiles with playoff-specific adjustments such as increased physicality and reduced pace. Historical records indicate that teams with superior defensive ratings in the final 20 regular-season games maintain that edge into postseason play at a higher rate than those with early-season defensive peaks. Market makers incorporate these patterns by shifting championship futures and series prices to reflect late-season trends rather than full-year averages. Reports from the Canadian Centre for Gaming Research highlight how regulatory frameworks in multiple jurisdictions require transparent documentation of how statistical inputs influence odds compilation throughout the year.
Conclusion
Seasonal statistical shifts continue to shape basketball betting markets through systematic incorporation of performance data, schedule effects, and efficiency trends that evolve from October 2026 onward. Comprehensive tracking of these patterns allows market participants to observe how lines respond to accumulating evidence rather than isolated results, producing pricing that reflects broader league dynamics across the full campaign.